
Australia had plenty of opinion about how empty the streets were in 2020 and very little evidence at the granularity that mattered. National mobility indices were too coarse to help a council decide anything, and survey data arrives months after the period it describes.
What did exist, largely unnoticed, was a network of pedestrian counters already installed in more than 180 locations around the country, quietly producing anonymous counts every ten minutes.
The COVID-19 Pedestrian Index Research Report was the result of pointing academic method at that dataset. It was produced jointly by Meshed and the SMART Infrastructure Facility at the University of Wollongong.
What was measured, and how
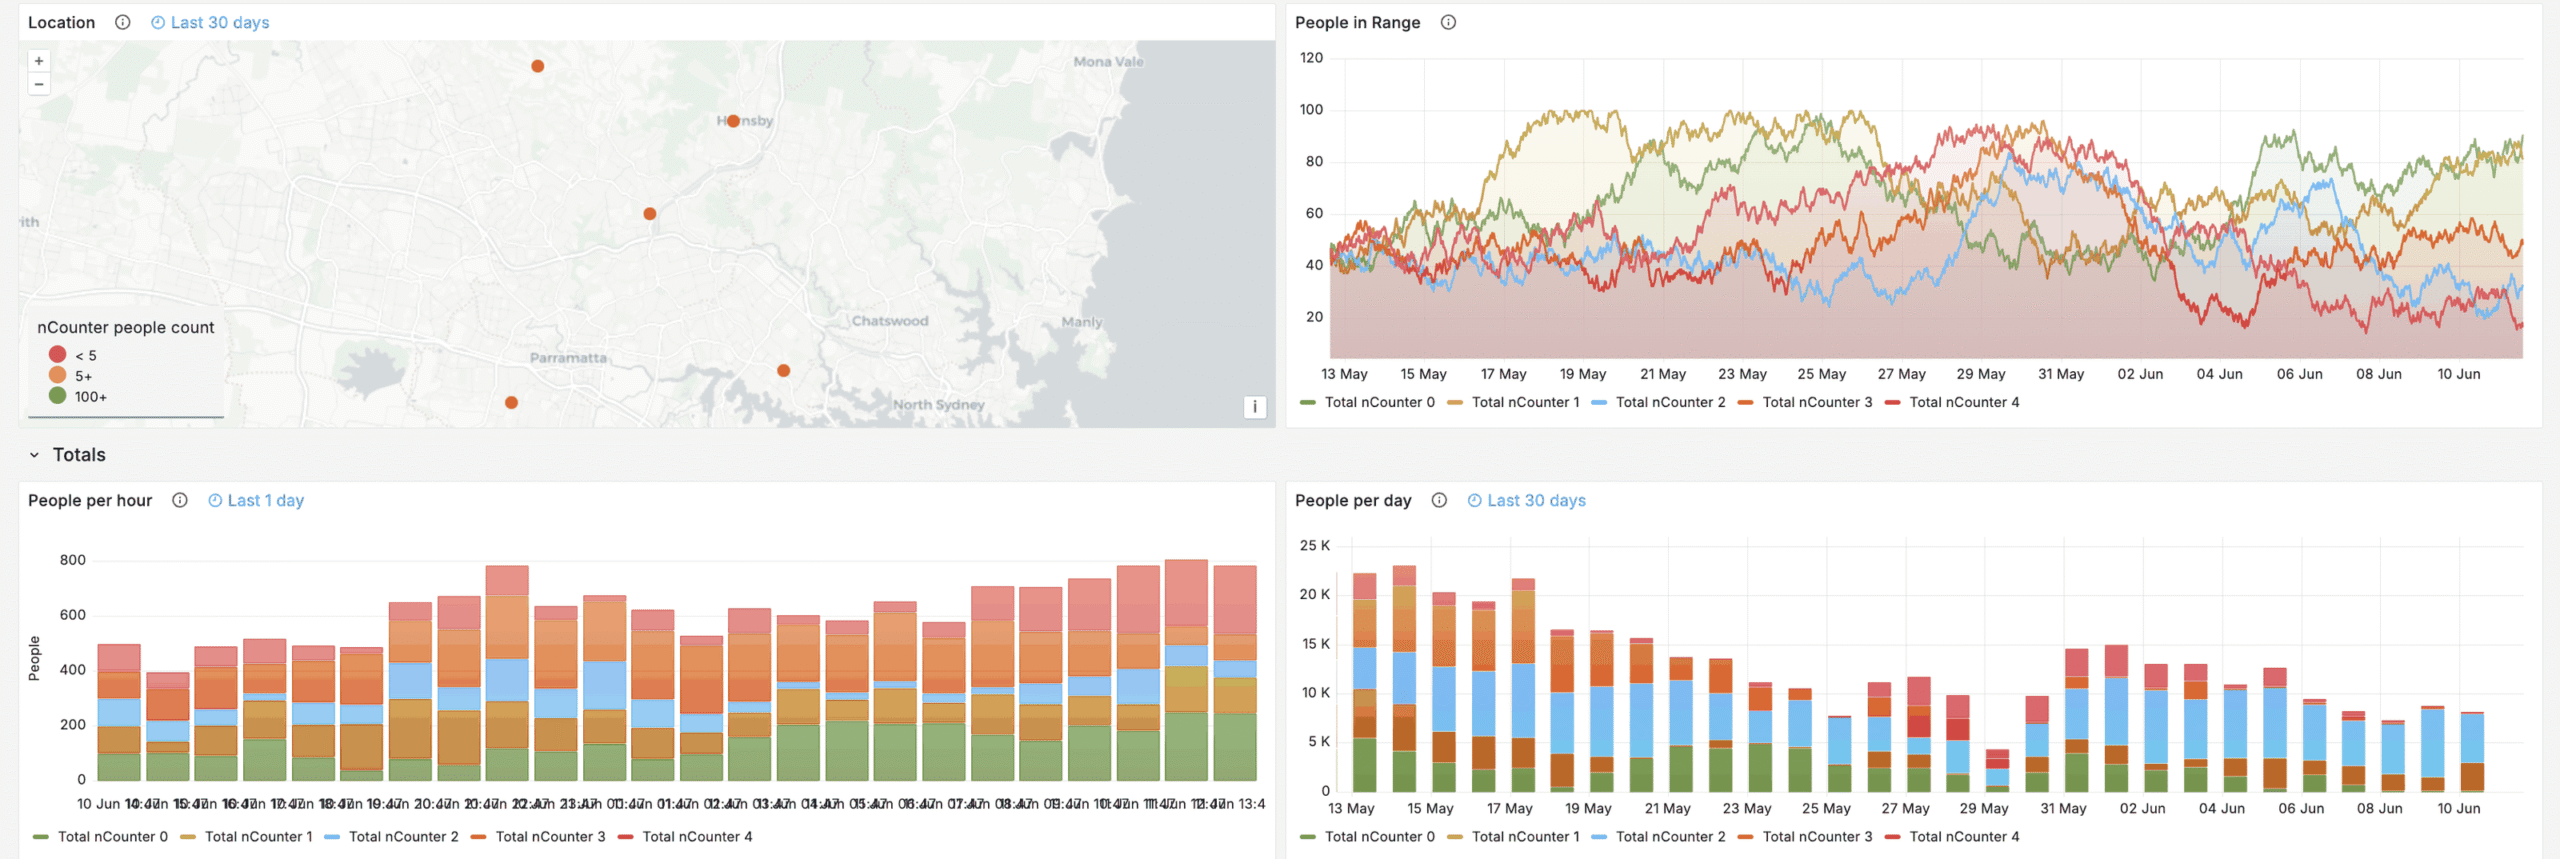
The dataset drew on more than 100 nCounter devices, collected with the support of 24 local government authorities, producing millions of individual data points.
The counting method matters here, because it determines what the data can and cannot tell you. nCounter is non-vision-based. It detects the wireless signals that nearby devices broadcast anyway, uses them as an anonymous proxy for the number of people present, counts locally on the device, and transmits only an aggregated number at the end of each interval. No personal information is collected, and no individual is identified or followed. What comes out is a count of how busy a place was, and nothing else.
That constraint is what made the research possible at this scale. A count that carries no personal information can be aggregated across two dozen council areas and published without a privacy impact assessment for every site.
What the data showed
Two findings stood out.
The immediate drop was sharp and uneven. Median pedestrian activity fell 36 percent as soon as restrictions came into effect in March 2020. In some locations the fall reached 60 percent. Averaged across all device locations, daily pedestrian traffic was down 60 percent after 18 March.
The unevenness was the useful part. A national average of minus 36 percent tells a council nothing actionable. Knowing which of its own precincts fell by 20 percent and which fell by 60 percent tells it where recovery support would do the most good. That was the explicit purpose of publishing the index, to show which areas had lost the most activity so assistance could be targeted rather than spread evenly.
Why continuous measurement changed the question
Before this, most councils understood pedestrian activity through occasional manual counts, typically a few days a year, usually in good weather, usually in the busiest part of the busiest street.
Continuous counting changes what can be asked. Instead of how many people walked past this point on a Tuesday in March, the question becomes how this precinct compares to the same week last year, which hours are actually busy, how long people stay, and whether last month's intervention made any measurable difference.
The 2020 research is a demonstration of that shift under unusually clear conditions. The intervention was abrupt, universal and precisely dated, which makes it about as clean a natural experiment as public space ever offers.
What this means for measuring public space now
The infrastructure that produced this research was not built for a pandemic. It was built so councils could understand how their public spaces were being used, and it happened to be in place when something worth measuring occurred.
That is the argument for continuous measurement generally. The value is not in any single number. It is in having a consistent, comparable baseline already running when you need to answer a question you did not anticipate.

More on people counting · smart cities.
This research was reported independently by IoT Hub, Australia's Internet of Things trade publication.
“Australian researchers tap pedestrian counters for COVID-19 project”, IoT Hub, 5 May 2020.
“Councils encouraged to tap pedestrian data for COVID-19 recovery”, IoT Hub, 16 October 2020.
Real-time intelligence across your entire precinct.