
Condition monitoring and real-time data across asset intensive operations.
More industries
Solutions
Our established industry solution pages.
Products
Browse the full Meshed product range and web store.
We connect the building data you already have, then fill the gaps with wireless sensors. Building health, energy, critical plant, occupancy and water, on one managed network and one view, without replacing the systems your teams already run.
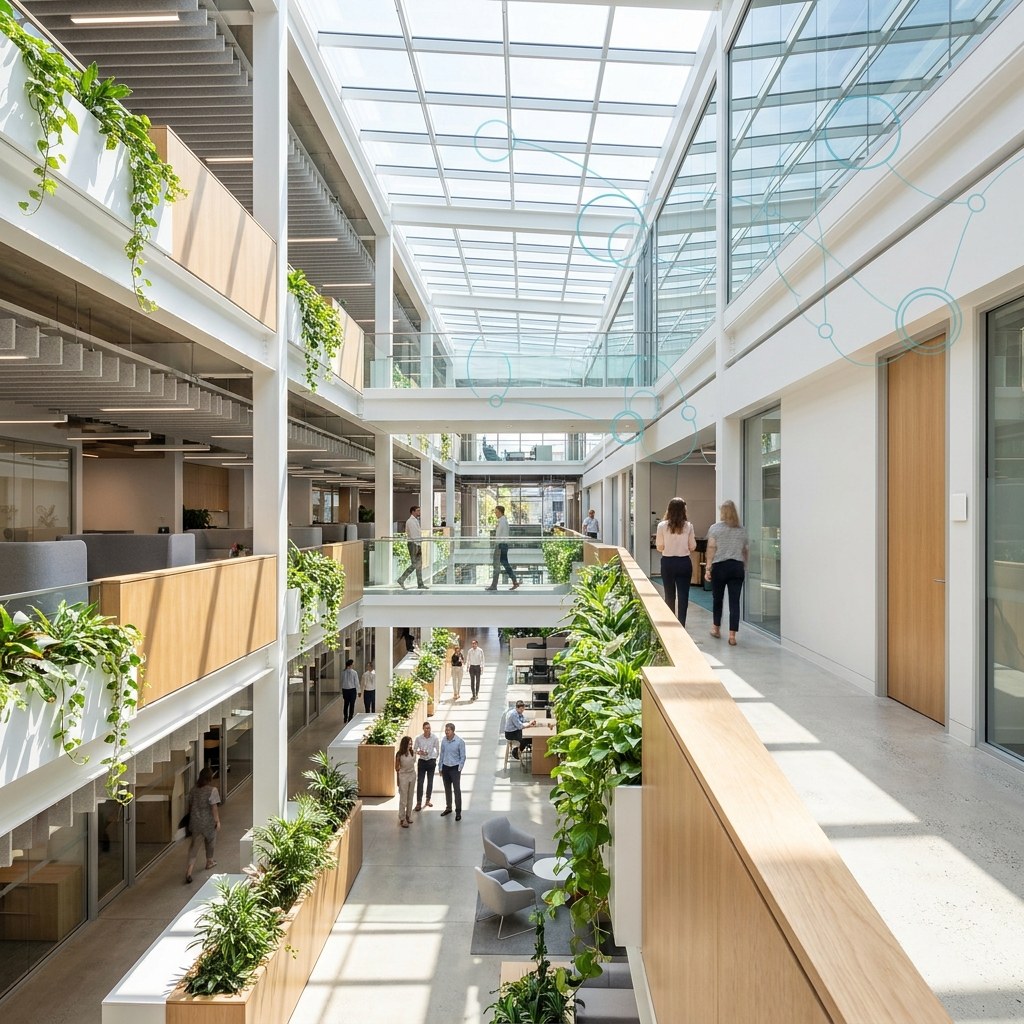
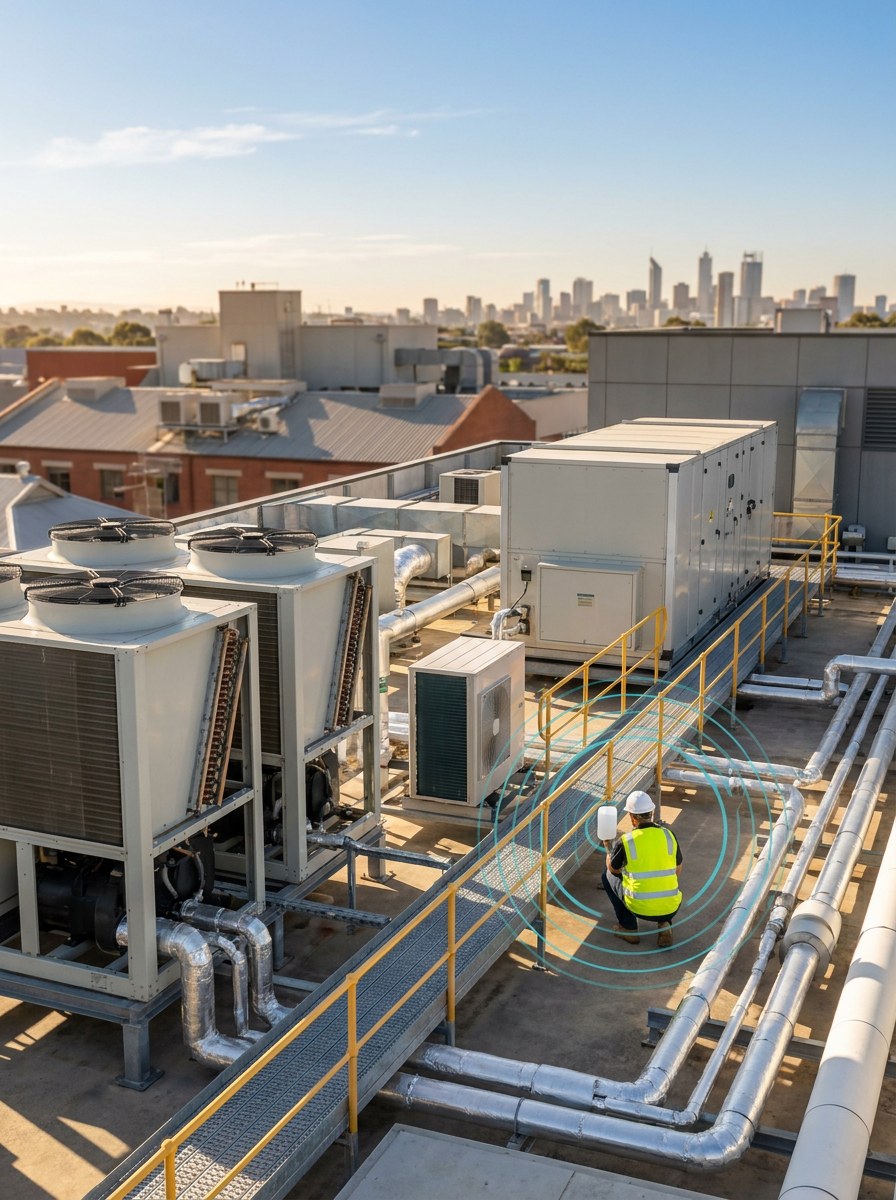
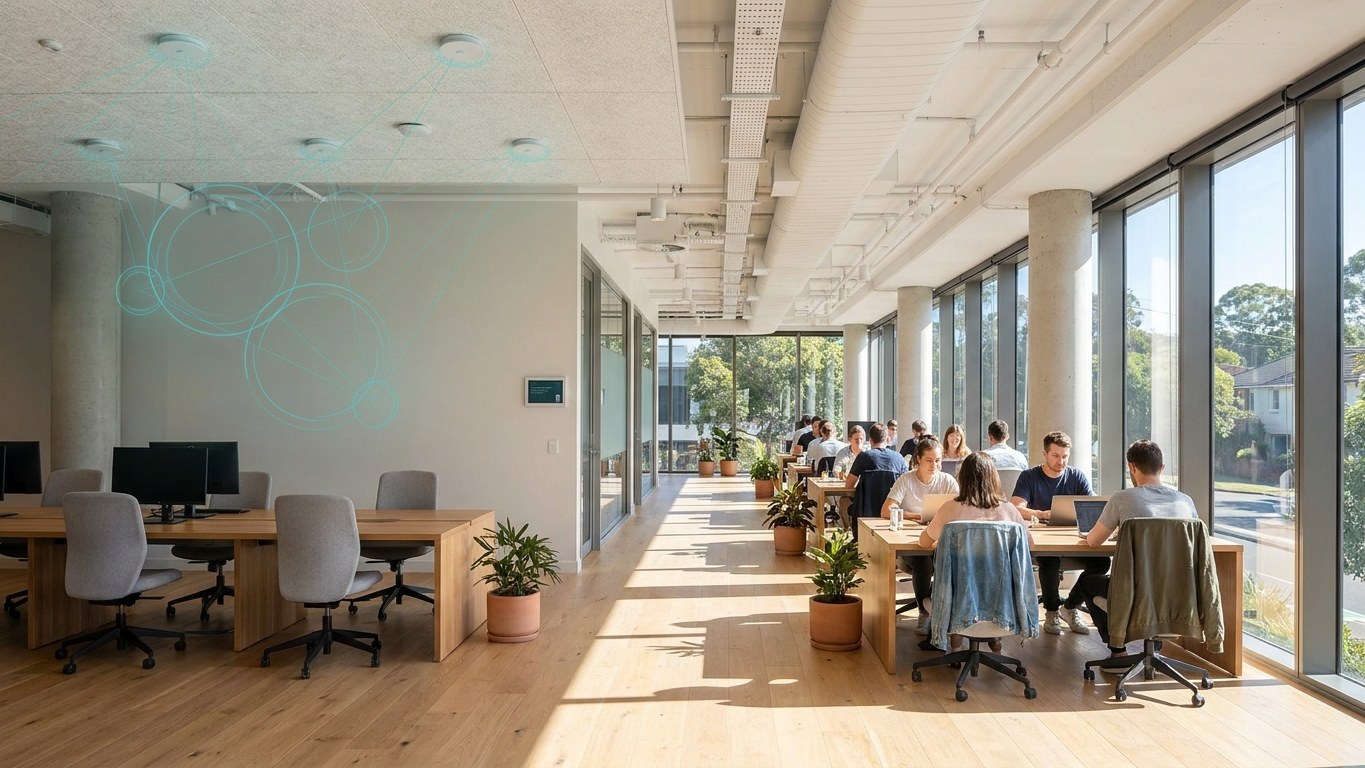
Building owners and facilities teams are under growing pressure to reduce operating costs, improve occupant experience, meet sustainability targets and maintain increasingly complex assets. Yet many buildings still depend on scheduled inspections, occupant complaints and alarms that are generated only after performance has deteriorated or equipment has failed.
Work starts after the fault, not before it.
Smaller, remote and legacy assets stay invisible.
The data lives in systems that do not talk to each other.
Building Management Systems (BMS), energy management platforms and specialist building control systems remain essential for operational control. However, they do not always provide visibility across smaller, remote, legacy or standalone assets. Extending wired monitoring to these assets can be expensive, disruptive and impractical.
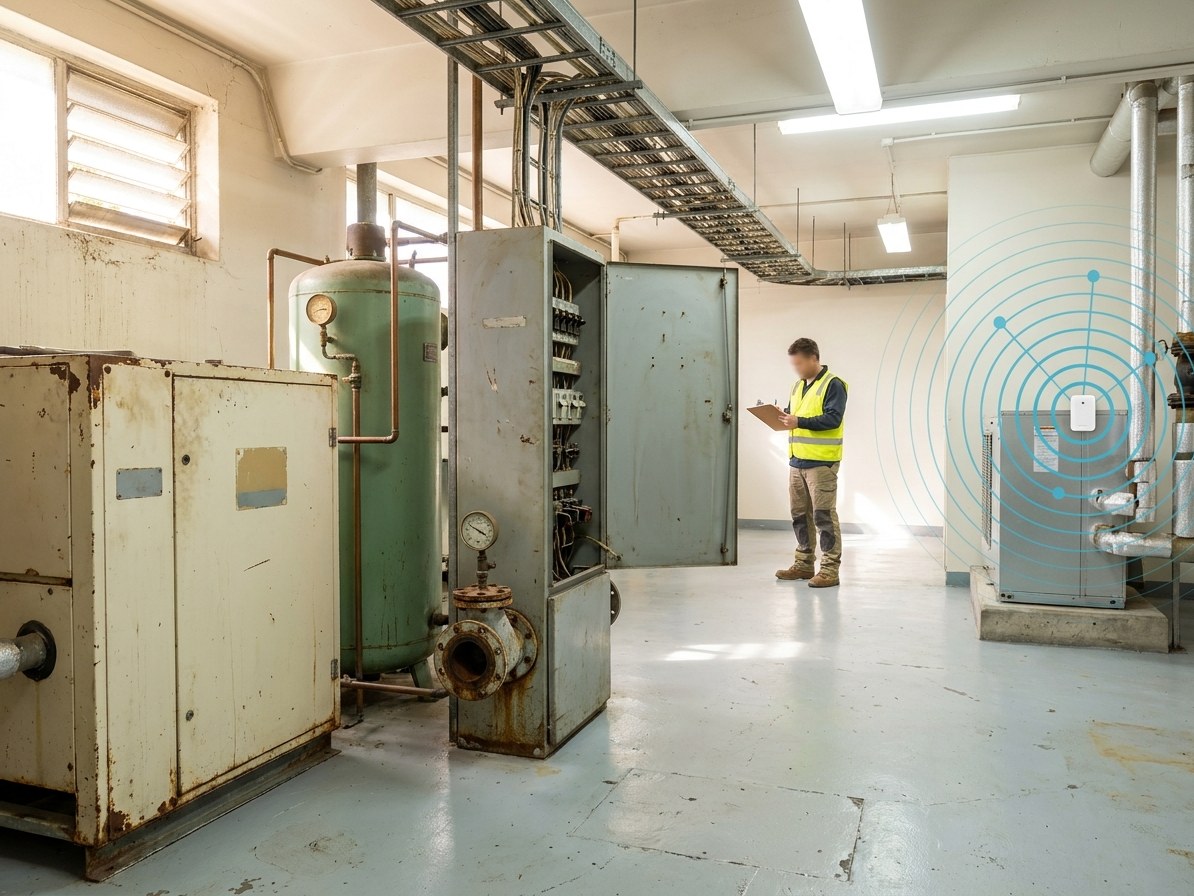
Without continuous, integrated visibility, facilities teams can face:
Smart Facilities Management is a data-driven approach to monitoring, maintaining and optimising buildings, services and critical assets. It combines wireless IoT sensors, existing BMS data, secure wireless connectivity, cloud analytics, automated alerts and open integration to turn disconnected building information into actionable operational intelligence.
The objective is not simply to collect more data. It is to provide facilities teams with a clearer understanding of how a building is performing, which assets require attention, where resources are being wasted and what action should be prioritised.
Our Smart Facilities Management solutions complement existing BMS and building control systems by using available BACnet, Modbus, MQTT and API data wherever possible, then filling monitoring gaps with low-power LoRaWAN sensors. This open approach protects existing technology investments and avoids unnecessary duplication.
This is an open approach, not a rip and replace. Your existing systems keep running while we fill the gaps they were never built to cover.
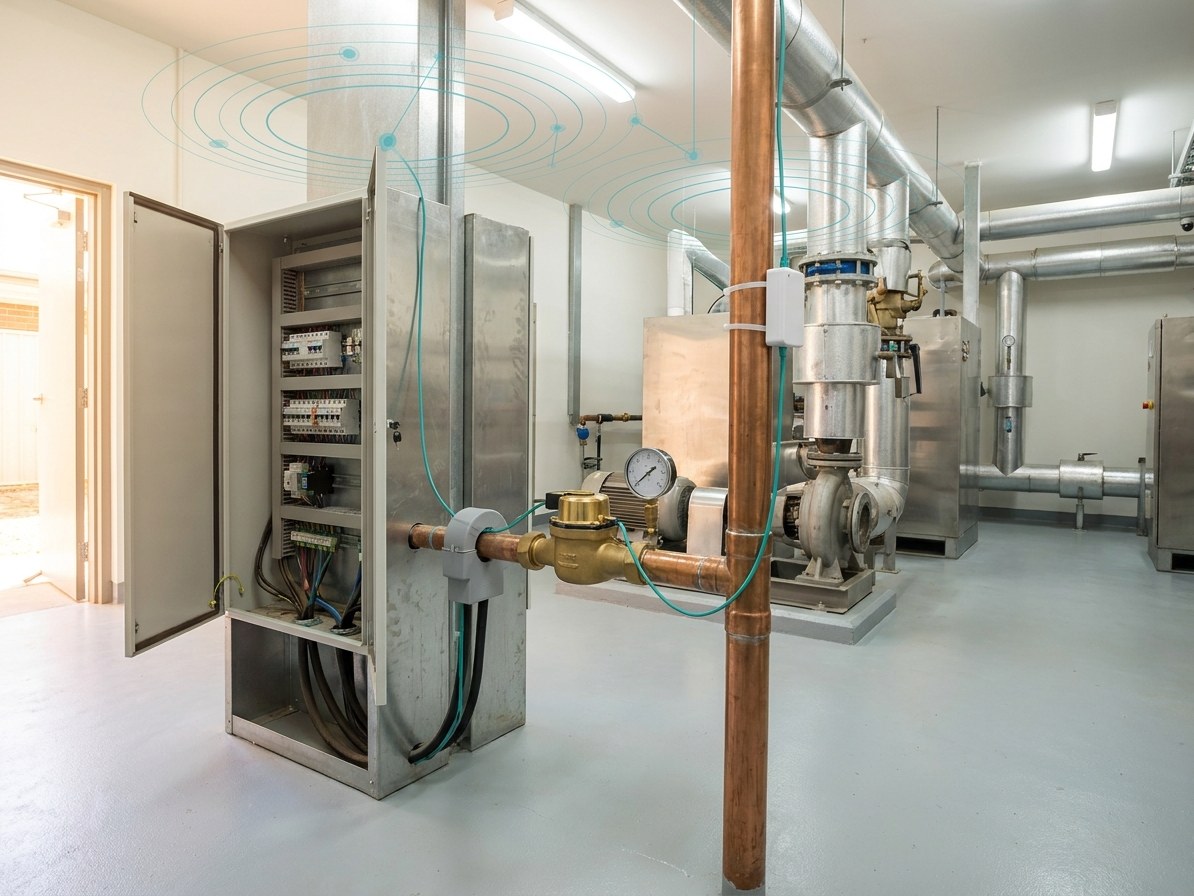
The five application areas below provide a practical framework for improving building performance, occupant outcomes and asset reliability.
Indoor air quality, temperature, humidity, CO2, VOCs, particulate matter, light and environmental comfort.
Healthier occupants, improved comfort, faster response to complaints and evidence to support WELL, NABERS and ESG objectives.
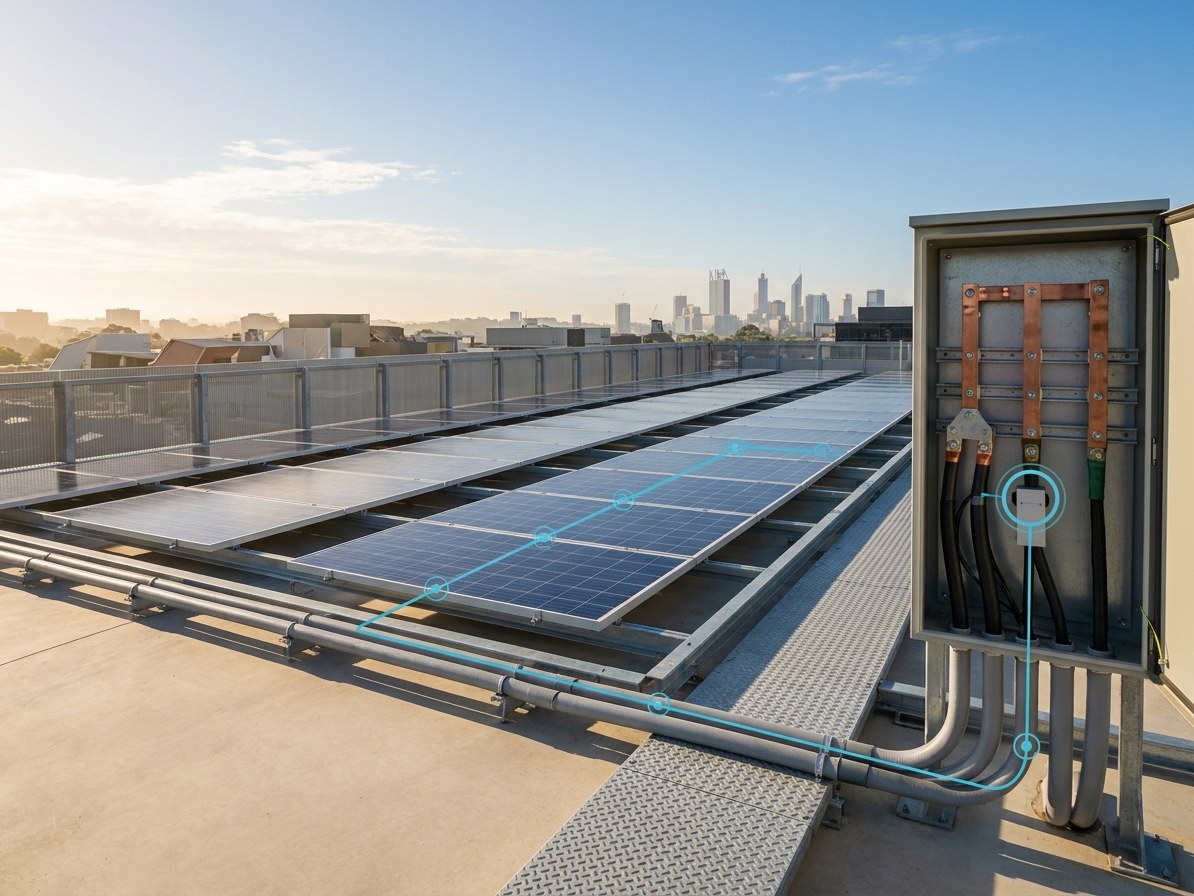
See how alerts are prioritisedElectrical switchboards, circuits, sub-metering, HVAC energy, solar generation, gas consumption, voltage and equipment runtime.
Lower energy costs, improved carbon reporting, verified efficiency initiatives and better capital planning.
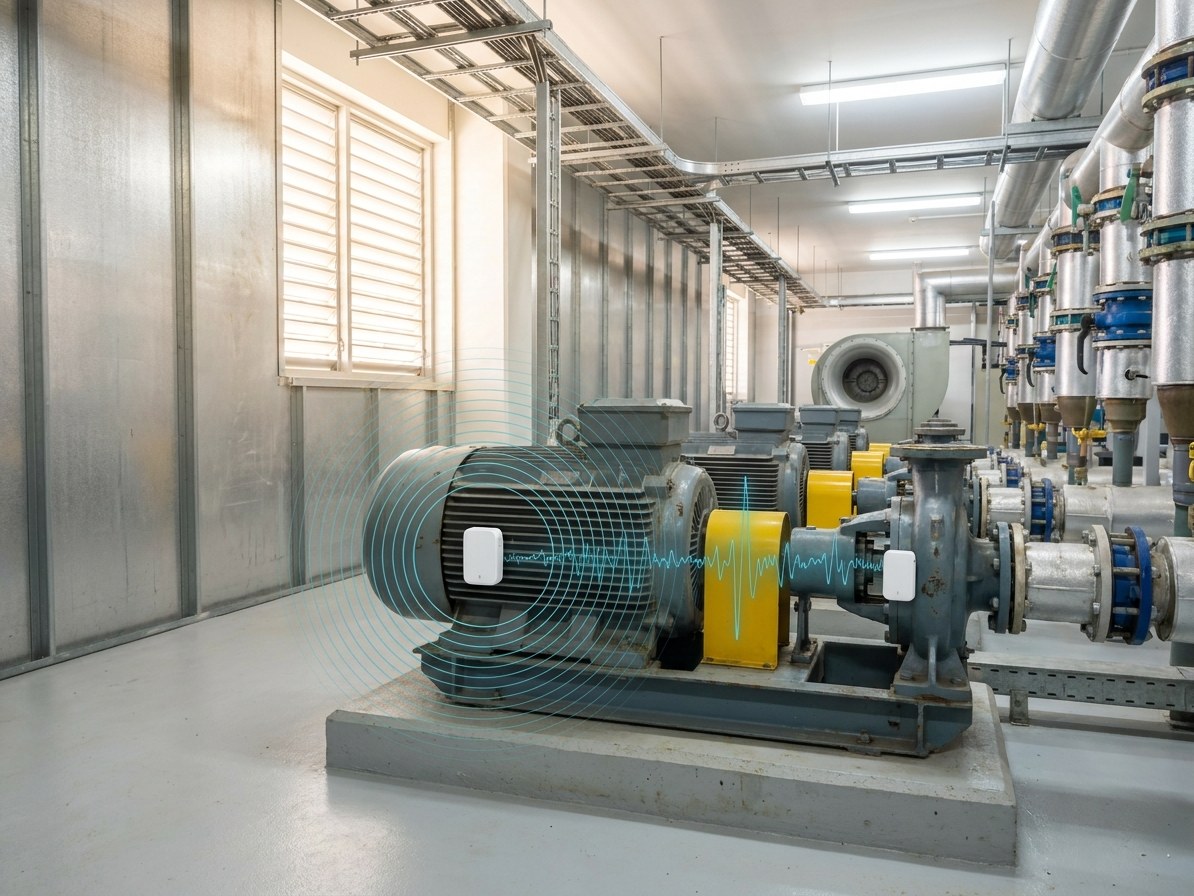
See how alerts are prioritisedHVAC, AHUs, FCUs, chillers, heat pumps, pumps, compressors, lifts, fans, motors, laundry equipment and other critical plant.
Earlier fault detection, fewer unplanned outages, reduced maintenance costs, longer asset life and improved service reliability.
See how alerts are prioritisedPeople counting, presence, meeting-room use, environmental comfort, door status, space utilisation and supplementary safety context.
Better workplace utilisation, optimised cleaning and services, improved occupant experience and enhanced operational awareness.
See the occupancy detailDigital water metering, sub-metering, leak detection, tank levels, pressure, pumps, irrigation, hot-water systems and flow monitoring.
Reduced water waste, lower costs, early leak response, improved resilience and better sustainability performance.
See how alerts are prioritised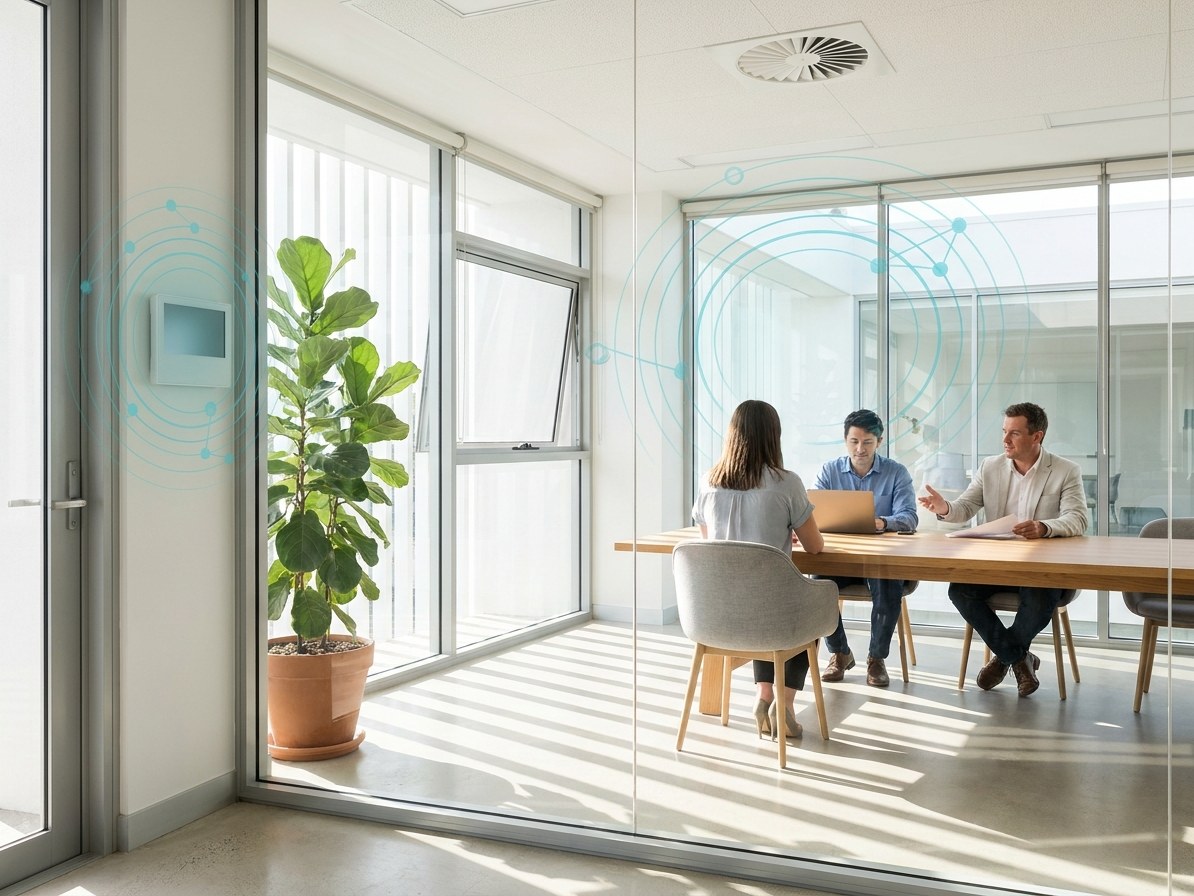
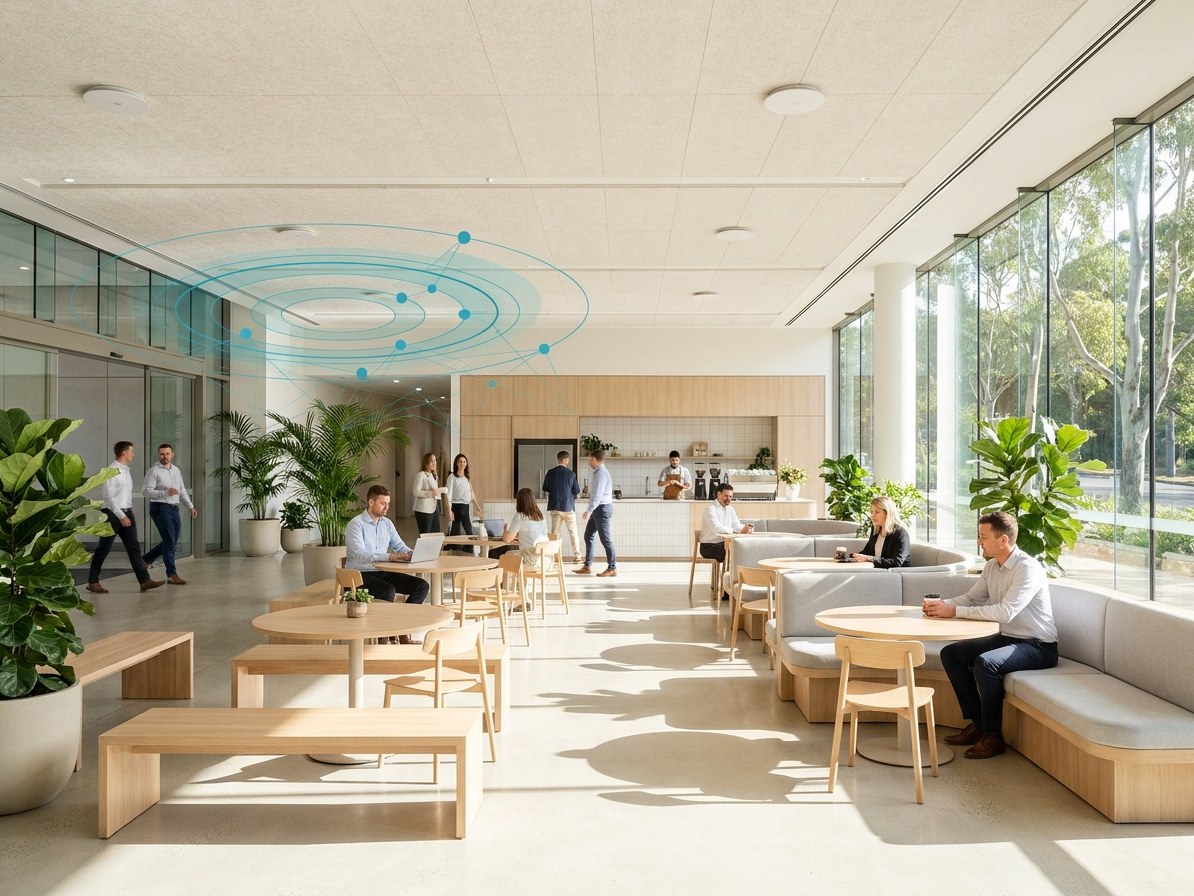
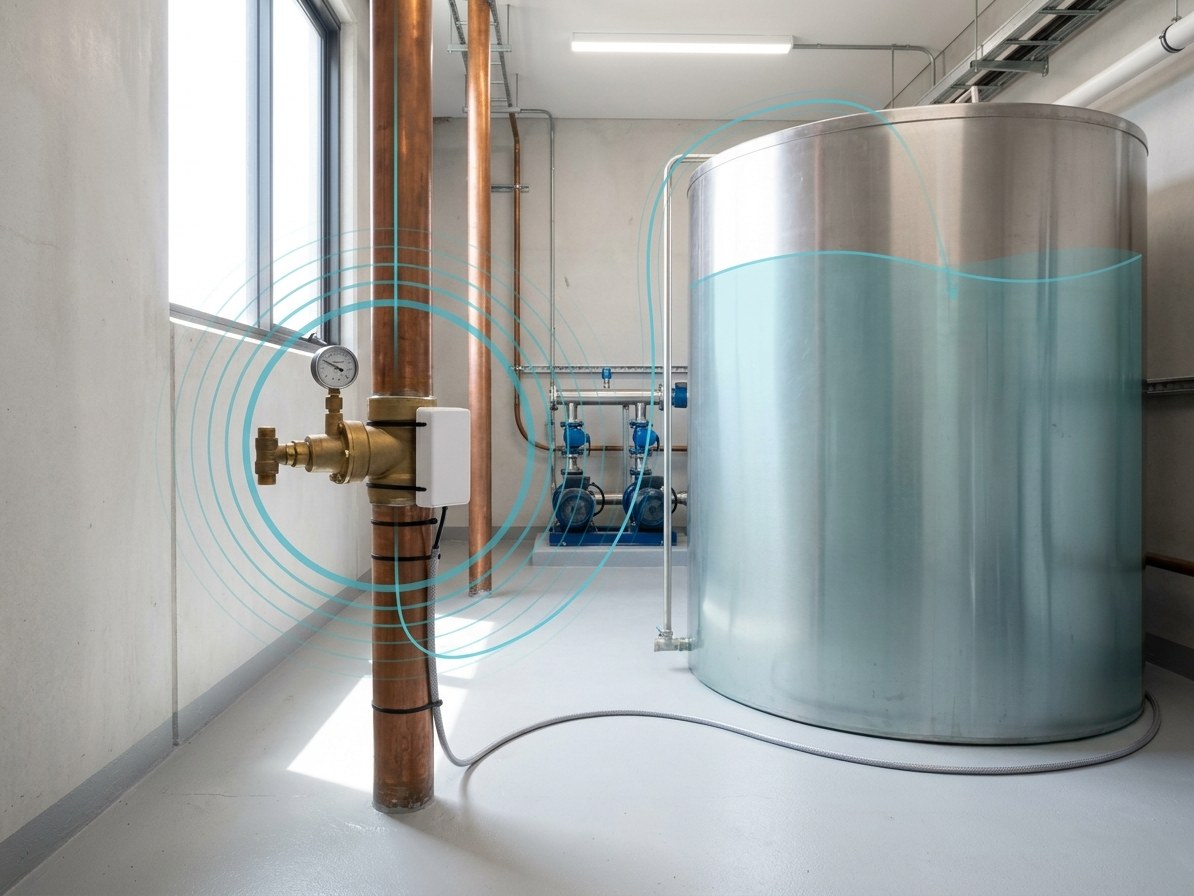
We deliver end-to-end Smart Facilities Management and building asset intelligence solutions for commercial buildings, campuses and property portfolios. By combining environmental sensing, energy and water monitoring, predictive asset analytics, managed LoRaWAN connectivity and enterprise integration, we enable facilities teams to transition from reactive maintenance to informed, condition-based operations.
Continuous carbon dioxide, temperature, humidity, particulate and comfort data across the spaces people actually occupy.
Switchboard and circuit-level sub-metering, tied back to the plant driving the load.
Vibration, current, pressure and runtime on the plant a building cannot operate without.
Anonymous, non-vision-based measurement of how spaces are really used.
Consumption, tank level, pressure and leak alerts across the hydraulic services.
BMS, CMMS, asset management, digital twin and BIM, business intelligence systems and AI and ML tools.
Five steps, in order, from the data your building already produces to the maintenance workflow that acts on it.
Nothing here requires the BMS to be replaced. Each step adds visibility the previous one could not reach.
Identify useful information already available through the BMS, meters, plant controllers, PLCs, VSDs and specialist building systems.
Deploy battery-powered LoRaWAN sensors where assets are not connected, communications cabling is impractical or additional condition data is required.
Combine sensor readings, alarms, runtime, energy and process data around the physical asset rather than displaying isolated data points.
Establish normal operating baselines, monitor thresholds and trends, and identify abnormal performance or emerging maintenance risks.
Send actionable alerts to facilities teams and integrate with CMMS, work-order, asset management and reporting platforms.
Collecting data is only the first step. Meshed Asset Intelligence applies thresholds, trend analysis and operating baselines to identify conditions that require attention. Typical alerts can include:
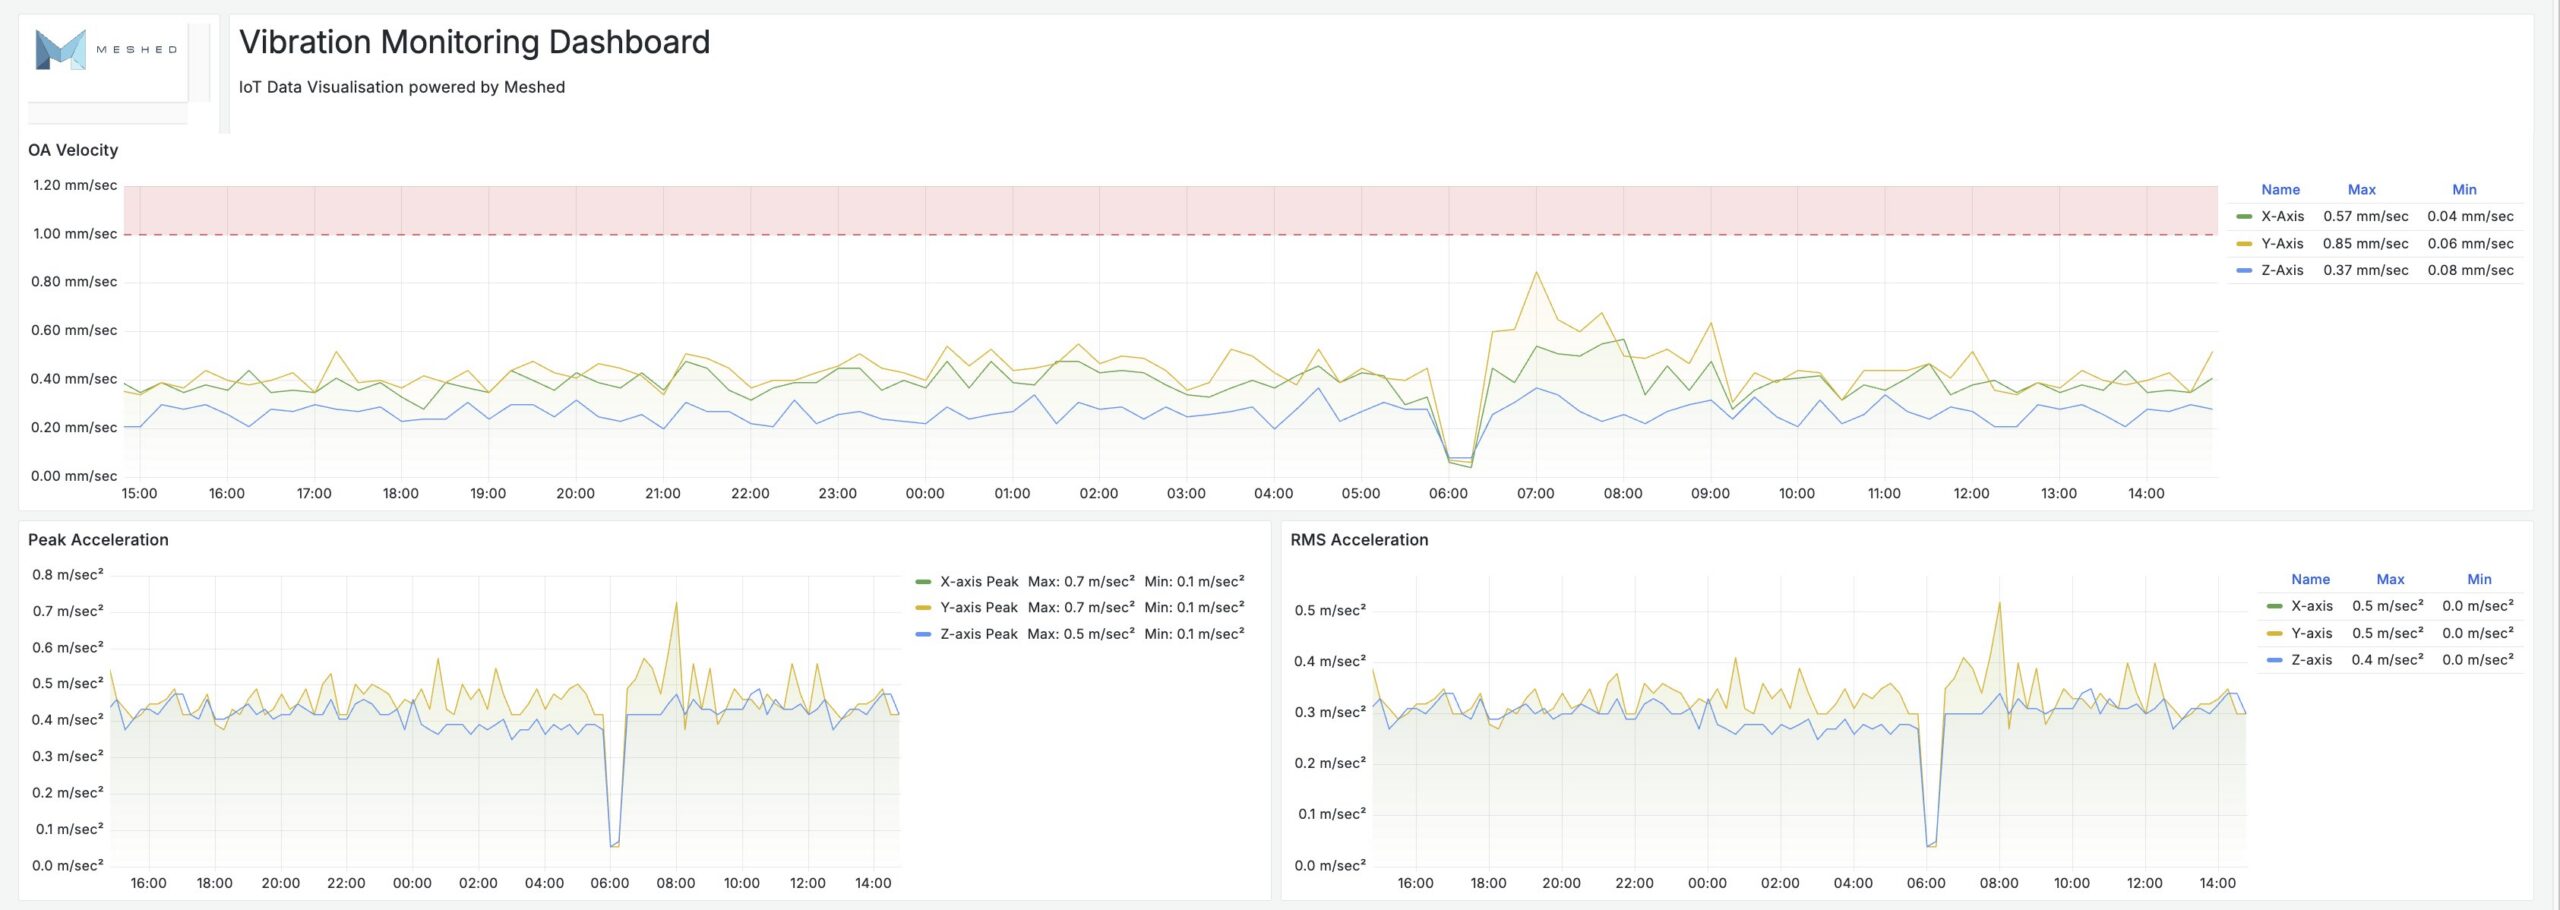
Our Asset Intelligence Platform enables alerts that can be prioritised by severity, asset criticality and operational impact, then delivered through the 24/7 dashboards, email, SMS or integrated maintenance workflows. This helps facilities teams focus on the assets requiring action rather than reviewing large volumes of raw sensor data.
Optimise facilities management with Meshed nCounter people counting
Facilities managers are increasingly expected to deliver exceptional occupant experiences while reducing operational costs and improving building performance. The Meshed nCounter People Counting Solution provides real-time, privacy-safe occupancy and foot traffic insights that enable facilities teams to manage spaces based on actual usage rather than assumptions.
Using low-power LoRaWAN technology, nCounter anonymously detects Wi-Fi-enabled devices to provide accurate people counting, dwell time analysis and utilisation trends without vision-based systems, personal data collection or reliance on the building's IT network.
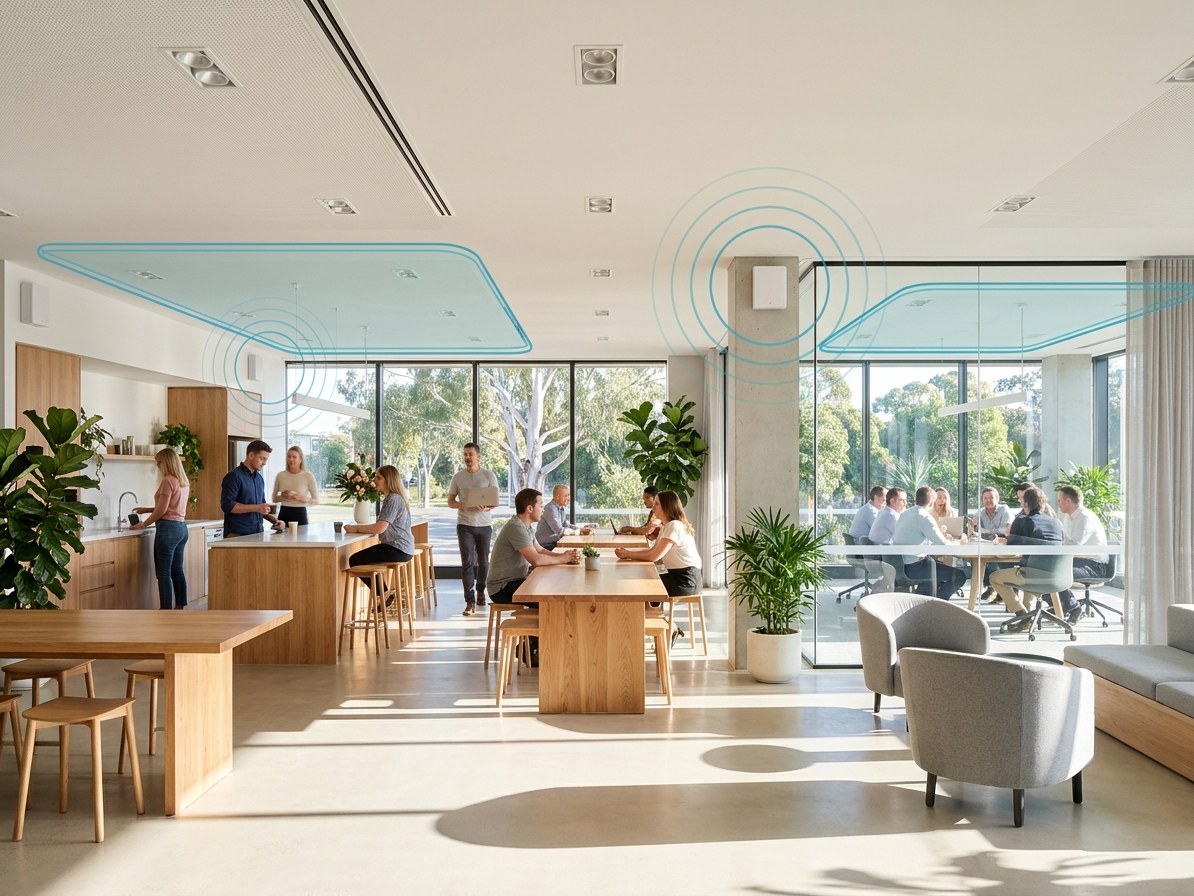
Data is presented through intuitive dashboards and can be integrated into existing Building Management Systems (BMS), CAFM platforms and business intelligence tools, enabling smarter decisions around cleaning, maintenance, staffing, energy management and space planning.
The solution is quick to deploy, highly scalable across single buildings or multi-site portfolios, and delivers actionable insights within minutes of installation. These capabilities help facilities teams improve service delivery, optimise operational expenditure and make evidence-based decisions with confidence.
Select a facilities management challenge to see how nCounter answers it and what it is worth.
One of Australia's leading universities embraced smart facilities management as part of a broader smart campus strategy, and kept scaling it because the operational picture it produced was better than the one inspections gave them.
During and after the COVID-19 pandemic the university deployed more than 3,000 IoT indoor environmental quality sensors across teaching spaces, lecture theatres, libraries and common areas, continuously monitoring temperature, humidity, carbon dioxide and other indoor air quality indicators.
Rather than relying on periodic inspections or occupant feedback, facilities teams gained real-time visibility into building conditions across multiple campuses. The data let operational staff optimise natural ventilation by informing door and window opening strategies, and adjust BMS HVAC settings to hold comfortable indoor temperatures and minimise periods of elevated CO2.
The success of the initial deployment led to a full rollout across the university's major campuses, where the platform continues to support healthier learning environments, improve occupant comfort, optimise building performance and guide future capital investment and sustainability initiatives.
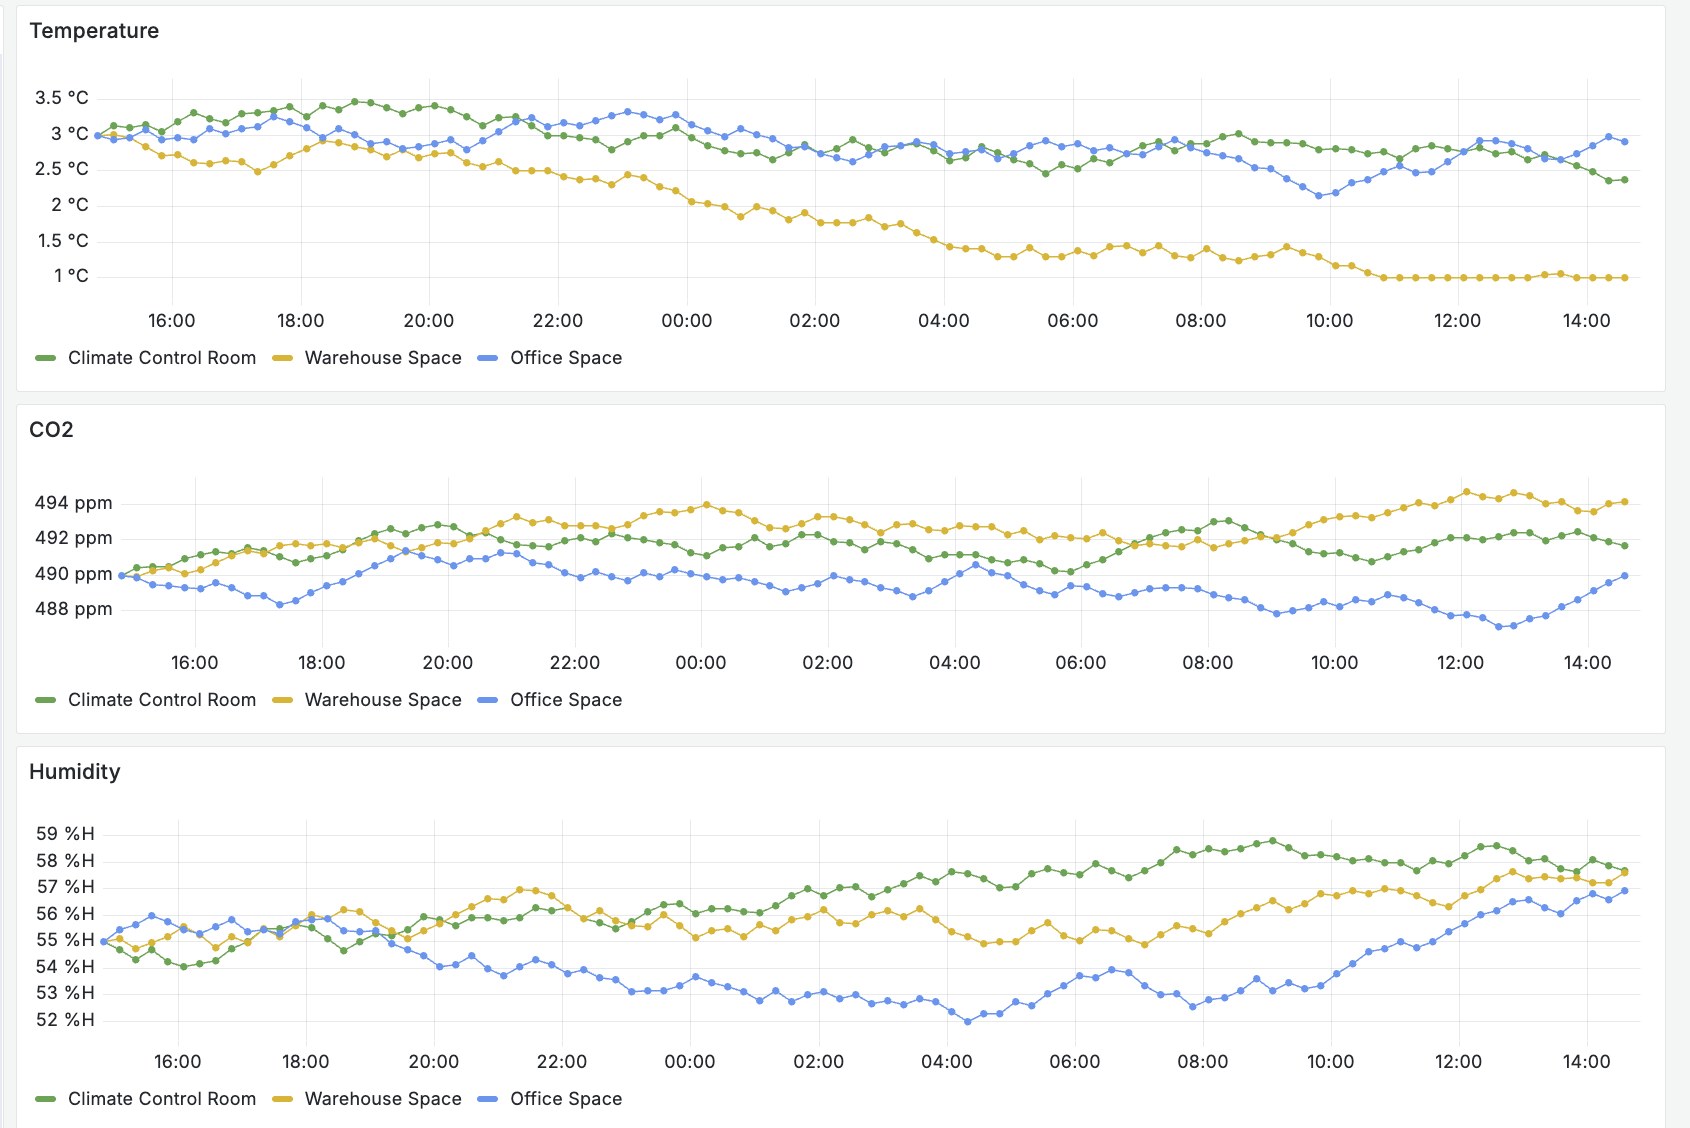
For property owners, facilities managers and service providers seeking greater visibility, efficiency and resilience, we provide a scalable and secure Smart Facilities Management platform that bridges traditional building systems and previously disconnected assets.
Unlike closed or siloed monitoring solutions, we combine managed LoRaWAN connectivity, device-agnostic sensing, open integrations and asset-focused analytics. Existing BMS and building control data can be retained and enriched, while new sensors are deployed only where additional visibility delivers value.
This approach enables organisations to begin with a focused proof-of-value deployment and expand across buildings, campuses or portfolios without replacing existing systems or becoming locked into a single device or software vendor.
Yes. We use open protocols and APIs, including BACnet, Modbus, MQTT and REST, to ingest available BMS, meter and controller data before adding sensors to fill monitoring gaps.
No. It complements existing building control and life-safety systems. Supplementary monitoring must not replace, override or delay certified fire detection, evacuation or emergency response procedures.
Applications include HVAC, heat pumps, chillers, boilers, pumps, lifts, fans, motors, switchboards, laundry equipment, indoor environments, occupancy, water systems, tanks and critical plant rooms.
Depending on the use case, reporting frequency and environment, many low-power devices can operate for five years or more without external power.
Yes. Alerts can be integrated with CMMS, service-management and work-order platforms to automate maintenance workflows and provide supporting trend information.
A focused proof-of-value deployment can often be operational in days using pre-configured gateways, sensors and dashboards, subject to site access and installation requirements.
Start with the building assets or operational issues where better information can produce a clear and measurable outcome. High-value pilot applications commonly include HVAC fans and filters, commercial hot-water heat pumps, lifts, pumps and motors, electrical circuits, indoor environmental quality, water metering and leak detection.
We can help define the use case, connect existing building data, select the appropriate sensors, deploy secure connectivity and configure dashboards and alerts. A focused pilot can demonstrate value quickly and provide a scalable foundation for wider deployment across your property portfolio.
Book a Smart Facilities Management demonstration using live asset data
Explore the Meshed Web Store for building and facilities monitoring sensors
Start a proof-of-value deployment with a Smart Buildings Starter Kit
Discover how the Meshed nCounter People Counting Solution can help you optimise cleaning schedules, improve space utilisation, reduce operational costs and make data-driven facilities decisions
Read the long-form view of connected buildings, browse the sensors that make it work, or understand the network underneath it.
How IoT is transforming facilities management from reactive to predictive, across air quality, energy, HVAC, occupancy and water.
Read it Web storeIndoor environment, energy and water metering, occupancy, vibration, leak detection and tank level, ready to order.
Browse it Managed networkThe Australian-hosted managed private LoRaWAN network the building sensors run on.
See it